The Benefits of Visualizing Data With a Scatter Chart
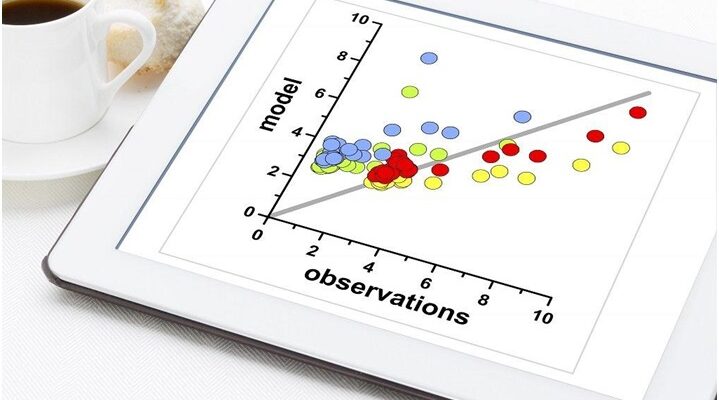
A scatter chart is a type of data visualization that can be used to show the relationship between two or more variables. Scatter charts can be used to show how one variable changes in relation to another or to show how multiple variables interact. Scatter …